


Market Insight- Global and India IT Spending in BFSI Market Overview 2026
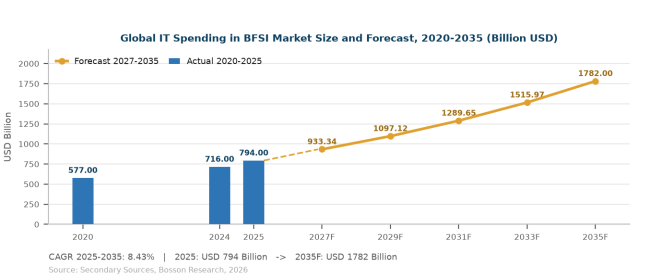
Global IT Spending in BFSI Market Was Valued at USD 794 billion in 2025 and is Expected to Reach USD 1,782 billion by the End of 2035, Growing at a CAGR of 8.43% Between 2025 and 2035.– Bossonresearch.com
Global IT spending in BFSI moved from USD 577 billion in 2020 to USD 716 billion in 2024 and USD 794 billion in 2025. The market has entered a sustained expansion phase as financial institutions replace fragmented legacy technology estates with cloud-enabled, data-driven and increasingly AI-supported architectures. The 2020-2025 compound rate of 8.34% reflects a five-year period in which digital transformation programmes accelerated rather than paused, and the 2025-2035 forecast of 8.43% assumes the same structural drivers continue to absorb capacity rather than plateau.
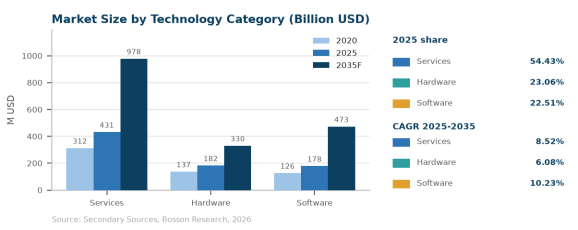
By technology category, Services represented 54.43% of global BFSI IT spending in 2025, followed by Hardware at 23.06% and Software at 22.51%. Services remain the largest spending pool through 2035 at USD 978.55 billion, while Software grows fastest at a 10.23% CAGR to USD 473.21 billion. Hardware grows slowest at 6.08% and reaches USD 330.13 billion. The gap between the fastest and slowest categories is 4.15 percentage points, a widening of the mix shift away from physical infrastructure toward licensed and cloud-delivered technology. On a 2024 base the same shares read 54.29%, 23.30% and 22.41%, so the mix moved 0.14 percentage points toward Services and 0.10 toward Software over a single year.
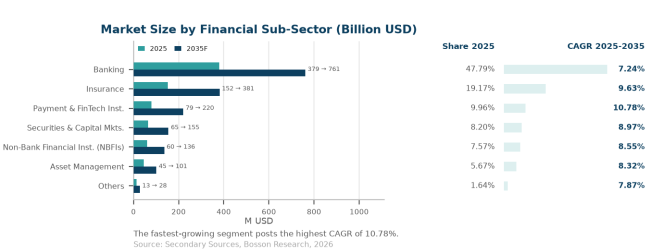
By financial sub-sector, Banking accounted for USD 379 billion of spending in 2025, representing 47.79% of the market, followed by Insurance at 19.17%, Payment & FinTech Institutions at 9.96%, Securities & Capital Markets at 8.20%, Non-Bank Financial Institutions at 7.57% and Asset Management at 5.67%. Payment & FinTech Institutions is the fastest-growing major category at a 10.78% CAGR, reaching USD 220 billion by 2035, followed by Insurance at 9.63%. Banking grows slowest at 7.24% but contributes USD 382 billion of absolute expansion, the largest single increment of any sub-sector. Others, covering specialised financial-market infrastructure and financial-data organisations, adds USD 28 billion by 2035 at a 7.87% CAGR.
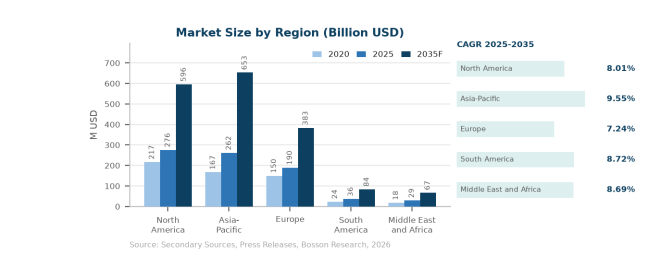
Regionally, North America remained the largest market in 2025 at USD 276 billion, representing 34.80% of global spending. Asia-Pacific followed at USD 262 billion, accounting for 33.04%, while Europe represented 23.96% at USD 190 billion. South America contributed USD 36 billion or 4.54%, and the Middle East and Africa USD 29 billion or 3.66%. Asia-Pacific is projected to grow fastest at a 9.55% CAGR to USD 653 billion by 2035, ahead of North America at 8.01%, Europe at 7.24%, South America at 8.72% and the Middle East and Africa at 8.69%. The Asia-Pacific lead comes from digital-first payment businesses, expanding capital-markets infrastructure and large-scale core-system replacement programmes across India, China and Southeast Asia.
Table 1 Global IT spending in BFSI by technology category, 2020-2035F (Billion USD)
|
Segment |
2025 |
2035F |
Share 2025 |
CAGR 25-35 |
|
Services |
432 |
979 |
54.43% |
8.52% |
|
Hardware |
183 |
330 |
23.06% |
6.08% |
|
Software |
179 |
473 |
22.51% |
10.23% |
|
Total |
794 |
1,782 |
100.00% |
8.43% |
Source: Bosson Research analysis, 2026.
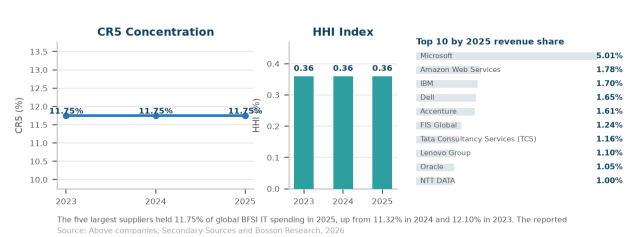
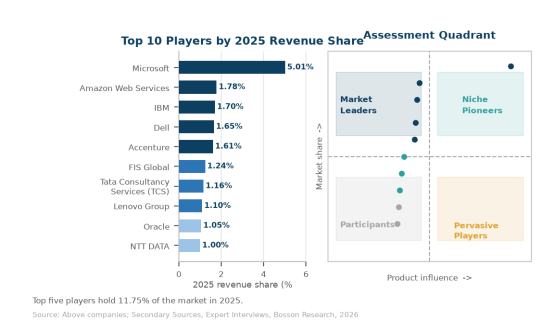
The market remains relatively fragmented from a supplier perspective. The top five companies, Microsoft, Amazon Web Services, IBM, Dell and Accenture, collectively accounted for 11.75% of global BFSI IT spending in 2025. The reported concentration index of 0.36% reflects the sum of squared revenue shares of the named suppliers under this study's methodology rather than a full-market Herfindahl-Hirschman Index computed across all participants, and it confirms a broad, multi-vendor supplier base rather than a concentrated oligopoly. Technology providers compete across cloud infrastructure, enterprise software, hardware, consulting, systems integration, cybersecurity, financial software, payments technology and data services, with differentiation moving toward industry-specific workflows, regulatory capabilities, data intelligence and AI governance.
Table 2 Global IT spending in BFSI by financial sub-sector, 2020-2035F (Billion USD)
|
Application |
2025 |
2035F |
Share 2025 |
CAGR 25-35 |
|
Banking |
379 |
761 |
47.79% |
7.24% |
|
Insurance |
152 |
381 |
19.17% |
9.63% |
|
Payment & FinTech Institutions |
79 |
220 |
9.96% |
10.78% |
|
Securities & Capital Markets |
65 |
155 |
8.20% |
8.97% |
|
Non-Bank Financial Institutions (NBFIs) |
60 |
136 |
7.57% |
8.55% |
|
Asset Management |
45 |
101 |
5.67% |
8.32% |
|
Others |
13 |
28 |
1.64% |
7.87% |
|
Total |
793 |
1,782 |
100.00% |
8.43% |
Source: Bosson Research analysis, 2026.
The structural forces shaping the 2025-2035 outlook are AI platformisation, cloud-native core transformation, security and regulatory compliance, and regional digital sovereignty. Generative AI and enterprise productivity is the fastest-growing AI investment theme in every financial sub-sector measured, compounding at 29.50% in Banking, 29.00% in Insurance and 27.30% in Non-Bank Financial Institutions against a 20.80% sector total. Regional investment priorities differ: North America concentrates on advanced analytics and security, Europe on compliance and data sovereignty, and Asia-Pacific on cloud migration and digital channel build-out.
Table 3 Global IT spending in BFSI by region, 2020-2035F (Billion USD)
|
Region |
2025 |
2035F |
Share 2025 |
CAGR 25-35 |
|
North America |
276 |
596 |
34.80% |
8.01% |
|
Asia-Pacific |
262 |
653 |
33.04% |
9.55% |
|
Europe |
190 |
383 |
23.96% |
7.24% |
|
South America |
36 |
84 |
4.54% |
8.72% |
|
Middle East and Africa |
29 |
67 |
3.66% |
8.69% |
|
Total |
793 |
1,783 |
100.00% |
8.43% |
Source: Bosson Research analysis, 2026.
Service Process Analysis of IT Spending in BFSI
Solution Planning and Delivery
India is the fastest-growing national market in the study. Spending rose from USD 8,366 million in 2020 to USD 13,213 million in 2024 and USD 15,014 million in 2025, and is projected to reach USD 45,138 million by 2035 at an 11.64% CAGR, 3.21 percentage points above the global average. Services account for USD 6,873 million of 2025 spending and Hardware USD 3,360 million, while Software is the fastest-growing category at a 13.49% CAGR to USD 16,955 million. Banking remains the largest sub-sector at USD 6,283 million, and Payment & FinTech Institutions grows fastest at 13.72%. India reached 1.89% of global BFSI IT spending in 2025 from 1.45% in 2020.
India's composition differs materially from the global average. On a 2024 base, Services represent 45.69% of Indian spending against 54.29% globally, while Software accounts for 31.70% against 22.41% and Hardware 22.61% against 23.30%. The gap indicates a market further along the licence-to-subscription and software-defined transition, consistent with a domestic banking sector rebuilding core platforms rather than extending mainframe estates. Indian growth is also concentrated in software-linked themes: Data & AI Applications in Banking compound at 14.36% and Data Analytics & AI in Insurance at 17.61%, both above their global equivalents.
AI investment in Indian financial institutions followed the same theme structure as the global market but at higher growth rates, with Generative AI & Enterprise Productivity the fastest-growing theme across every sub-sector measured. Data & AI Applications in Banking compound at 14.36%, Data Analytics & AI in Insurance at 17.61% and Generative AI in Non-Bank Financial Institutions at 27.30%. The pattern is consistent across both geographies: decision and intelligence analytics and risk and compliance intelligence absorb the largest absolute budgets, while generative AI absorbs the fastest growth because it starts from a small installed base of enterprise deployments.
The India market is projected to compound at 11.64% through 2035, reaching USD 45,138 million, which adds USD 30,124 million of spending over the base year. Banking contributes USD 10,286 million of that increment, Insurance USD 4,953 million and Payment & FinTech Institutions USD 5,949 million. Software adds USD 12,173 million against USD 13,193 million for Services and USD 4,757 million for Hardware, so the incremental spend is more software-weighted than the installed base.
Logistics and Customer Delivery
The competitive structure of BFSI IT differs from most industrial markets because demand is distributed across many categories of supplier. Cloud infrastructure, enterprise software, hardware, consulting, systems integration, cybersecurity, payments technology, financial software and data services compete for overlapping portions of the same budget, and a single contract may be split across several vendors. This architecture explains why the five largest suppliers hold only 11.75% of global spending, and it raises the practical significance of integrator and managed-service relationships for suppliers seeking share.
Development Trends
India's supplier base is unusually strong in offshore delivery, with Tata Consultancy Services at USD 9,200 million, Infosys at USD 5,340 million, Wipro at USD 3,230 million, HCLTech at USD 2,770 million, LTIMindtree at USD 1,650 million, Mphasis at USD 1,130 million and Tech Mahindra at USD 950 million of 2025 BFSI-related revenue. Combined with global delivery from Indian headquartered operations, this supplier concentration supports the 11.64% national growth rate, since offshore providers capture both global contract value and domestic demand.
Service providers are broadening their banking capabilities well beyond infrastructure migration. Across 28 evaluated providers, cloud migration, intelligent automation and AI adoption are the dominant focus areas, with nearly 90% of providers supporting core infrastructure migration to cloud environments and 86% delivering cloud-native services. Roughly two-thirds also collaborate on next-generation banking architecture, digital payments and sustainable finance, which indicates that the addressable service pool is widening rather than consolidating around a narrow set of platform mandates.
Tier structure follows 2025 revenue attributable to BFSI customers. Tier 1 covers suppliers above USD 10 billion, Tier 2 spans USD 1 billion to USD 10 billion, and Tier 3 covers the remainder. Five companies sit in Tier 1: Microsoft, Amazon Web Services, IBM, Dell and Accenture. The tiering illustrates that global scale does not translate into vertical dominance, because the revenue base of most technology groups spans markets far larger than financial services.
The forecast rests on four assumptions that can be tested against observed data. First, that institutions continue replacing fragmented legacy estates rather than extending them, consistent with sustained Services growth of 8.52%. Second, that AI and data engineering budgets compound above the market average, supported by theme-level CAGRs of 27.30% to 29.50% for generative AI. Third, that regulatory and data-sovereignty requirements continue to shape vendor selection. Fourth, that regional divergence persists, with Asia-Pacific and India compounding above the global average while Europe trails. A shift in any one of these would change the shape of the forecast without altering the direction of growth.
The period from 2025 to 2026 marks a critical turning point for the IT spending in BFSI industry. Leading players are entering a high-growth trajectory, expanding capacity, winning new contracts, and extending their geographic reach through acquisitions and long-term partnerships.
Measuring this market requires care about what is counted. Supplier revenue attributable to financial institutions is the measured quantity, not institutions' total technology budgets, and the two diverge substantially where banks operate captive data centres, employ internal engineering teams or allocate shared infrastructure costs. Comparisons with vendor-reported financial-services revenue are subject to differing segment definitions, and comparisons with institutional budget surveys differ because supplier-side revenue nets out reseller and subcontracted delivery. The approach taken here holds the supplier-revenue basis constant across all periods and sub-sectors, so trends remain comparable even where absolute levels differ from budget-based figures.
Sustainability is moving from a peripheral public-relations commitment to a core competitive factor, with resource and environmental management now central to procurement decisions and to the operational upgrades taking place across the value chain.
Demand-side behaviour is shaped by three mechanisms. Institutions buy against legacy replacement cycles, which produces lumpy multi-year contract structures rather than smooth annual growth. AI and data engineering programmes are funded as discrete transformation budgets, so they scale faster than run-rate infrastructure spending and then normalise. Regulation functions as both a cost and a demand generator, since compliance requirements create spending that is not discretionary and therefore survives budget tightening better than discretionary transformation projects.
Pricing in this market is contract-structure driven rather than unit-price driven. Enterprise agreements combine licence, subscription and managed-service components with multi-year commitments, and the shift from perpetual licence to subscription has changed both the revenue recognition profile of vendors and the total cost of ownership visible to buyers. Infrastructure commoditisation lowers unit costs of compute while raising the share of spend absorbed by managed operations and specialised advisory work.
Supply-side capacity is being added where demand is clearest. Data-centre and accelerator capacity expanded through 2024 and 2025 in response to AI demand, which supports both cloud platform pricing and infrastructure vendor revenue. The constraint on delivery has shifted from hardware availability toward specialised talent, model governance expertise and regulatory implementation capability, which favours vendors with established financial-sector delivery records.
Cost pressure and value-added mix run in parallel across the industry. In an environment of input inflation and rising energy prices, operators must control costs while simultaneously upgrading product quality to meet rising customer expectations, a tension that is reshaping offerings, sourcing strategies, and service models.
Customer preferences are also recalibrating: authenticity is becoming a decisive driver of demand, with a large share of global consumers willing to pay a premium for locally sourced, higher-quality options, pushing producers toward more experiential and culturally resonant solutions.
The market sits in an expansion phase rather than a maturity or decline phase. The category has no single replacement unit, and its scope is defined by institutional spending behaviour rather than a product generation cycle, so the product life cycle framework applies to solution categories within the market rather than to the market as a whole. Core banking systems sit in a mature phase with an ongoing replacement cycle attached, cloud platforms occupy a growth phase, and generative AI tooling is in an early phase with expanding adoption and unsettled vendor structures.
The supplier assessment framework used in this study positions companies on two dimensions, market share and BFSI-specific product influence. The second dimension deliberately excludes overall corporate scale, because a company may command a large share of global BFSI spending through infrastructure or consulting work without owning a distinctive financial-sector product. Companies that combine meaningful share with influential BFSI-specific offerings occupy the leader quadrant.
For suppliers, the practical implication of this structure is that winning a defined slice of the budget matters more than owning the platform relationship. Institutions distribute technology procurement across specialised categories, and vendors that integrate industry-specific workflows, regulatory capabilities, data intelligence and AI governance into their offerings capture more of the budget than vendors selling standardised products and infrastructure. The same logic applies to India, where Indian-headquartered delivery partners hold positions that global peers with comparable technology do not.
The principal source of forecast error in this market is the treatment of AI spending. If generative AI moves from project budgets into run-rate operating expenditure, the growth profile of the theme shifts from high-double-digit compounding to something closer to the Services average, and the 2025-2035 total falls short of the stated forecast. If AI investment instead expands the total addressable budget by displacing rather than supplementing existing lines, the aggregate market grows faster than projected. The theme-level data in this report makes both scenarios testable against observed data rather than assumption.
Operational Transformation Driven by Digitalisation and AI
The India chapter deserves separate treatment because the national growth rate of 11.64% diverges from the global 8.43% by 3.21 percentage points, a gap wide enough to change vendor strategy on its own. Indian spending compounds faster because the software mix is heavier, the domestic core-banking replacement cycle is running in parallel with cloud migration rather than after it, and offshore delivery capacity positioned in India captures both domestic and international contract value.
This operational transformation is particularly important as labor costs rise and solution complexity grows. Automation and robotics allow leading players to absorb cost pressure while smaller operators face margin deterioration and consolidation pressure, accelerating industry concentration.
Regional investment priorities differ in kind rather than only in scale. North America concentrates on advanced analytics, AI platforms and security, supported by a mature banking ecosystem and high cloud adoption. Europe emphasises compliance, regulatory reporting and data sovereignty, which raises the share of spending directed to governance and residency-sensitive infrastructure. Asia-Pacific directs investment toward cloud migration and digital channel build-out, with India and Southeast Asia leading that expansion.
Africa, the Middle East and South America together account for 8.25% of global spending in 2025 and grow at 8.72% and 8.69% respectively, close to the global average despite small bases. These markets are characterised by greenfield digital banking build-out rather than legacy replacement, which shifts spending toward cloud-native platforms and reduces the share captured by hardware. For suppliers, the practical pattern is that these regions present lower per-institution contract values but a higher rate of new platform adoption.
Rapid changes in customer demand are raising product and operational requirements. Customers increasingly expect higher-quality, better-integrated, outcome-oriented options and branded, experience-oriented solutions that reflect their evolving preferences.
This structural upgrade is pushing the supply chain from standardized delivery toward highly customized systems, increasing solution complexity and raising the value of flexible, data-driven planning and inventory management.
For providers that manage the transition well, a higher-value mix creates clear opportunities to raise revenue per customer and to differentiate against competitors, converting a cost item into a source of strategic advantage.
Global IT Spending in BFSI Market: Competitive Landscape
The most reliable signals for tracking this market are the theme-level investment lines rather than the aggregate. The global Data & AI Applications line for Banking stands at USD 83.30 billion with a 10.14% CAGR, Data Analytics & AI in Insurance at USD 28.87 billion with 13.62%, and Data & AI Applications in Payment & FinTech at USD 15.83 billion with 14.50%. These are the budget pools where decisions taken in 2025 determine whether the 2025-2035 forecast holds, and they are the lines to track quarter by quarter.
This study is produced by Bosson Research. The analysis draws on secondary market sources, company disclosures, press releases and primary research across the supplier and buyer base, with figures triangulated across independent sources and cross-checked against supplier-reported financial-services revenue. All values for 2025 are actuals; values for 2035 are estimates derived from the stated forecast model.
Table 4 Global IT spending in BFSI market concentration, 2025 (revenue share and HHI)
|
Company |
2023 |
2024 |
2025 |
Type |
|
Microsoft |
4.49% |
4.68% |
5.01% |
Tier 1 |
|
Amazon Web Services |
1.46% |
1.58% |
1.78% |
Tier 1 |
|
IBM |
2.09% |
1.80% |
1.70% |
Tier 1 |
|
Dell |
2.12% |
1.65% |
1.65% |
Tier 1 |
|
Accenture |
1.94% |
1.62% |
1.61% |
Tier 1 |
|
Tata Consultancy Services (TCS) |
1.43% |
1.29% |
1.16% |
Tier 2 |
|
FIS Global |
1.45% |
1.30% |
1.24% |
Tier 2 |
|
Cisco Systems |
1.23% |
1.03% |
1.00% |
Tier 2 |
Source: Bosson Research analysis, 2026.
Key players in the IT Spending in BFSI Market include:
Amazon Web Services
IBM
Dell Technologies
Accenture
FIS Global
Tata Consultancy Services
Oracle
NTT DATA
Request for more information
Click to view the full report TOC, figure and tables: https://www.bossonresearch.com/yjbg
About US:
Bosson Research (BSR) is a leading market research and consulting company, provides market intelligence, advisory service and market research reports for the automobile, electronics and semiconductor, and consumer good industry. The company assists its clients to strategize business policies and achieve sustainable growth in their respective market domain.
Bosson Research provides one-stop solution right from data collection to investment advice. The analysts at Bosson Research (BSR) dig out factors that help clients understand the significance and impact of market dynamics. Bosson Research (BSR) bring together the deepest intelligence across the widest set of capital-intensive industries and markets. By connecting data across variables, our analysts and industry specialists present our customers with a richer, highly integrated view of their world.
Contact US:
Tel: +86 400-166-9288
E-mail: sales@bossonresearch.com
